Date: 4 April, 2019 - Blog
There has always been a close negative correlation between manufacturing PMI and the US 10-year yield as the Treasury has always been considered the de facto safe haven when investors panic over a global slowdown.
The recent yield collapse and the yield curve flattening followed the IHS Markit manufacturing PMI release in March to a 21-month low, while the services PMI weakened to a two-month low. The manufacturing PMI fell to 52.5 from 53 in February, while the services PMI fell to 54.8 from 56.
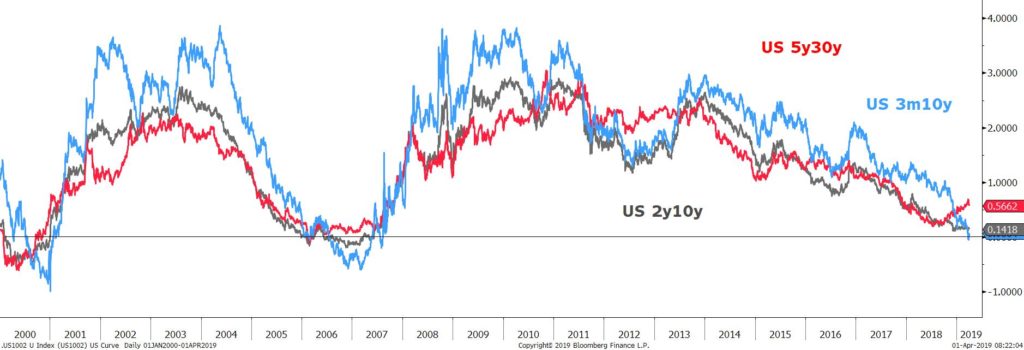
All the attention has turned on the inversion of the yield curve. It is important to notice that there are many parts of the yield curve to focus on. Some parts of the curve inverted last year, and some other parts of the curve are still positive. While the 3m10y turned negative, the 2y10y and 5y30y remain positive. So, different yield curves segments tell us different stories. Those different signals can partly be explained by the QE driven distortion.
US yield curve
One of the key sources of stress came from China which was sharply decelerating. To fight its economic slowdown, policy makers urged banks to lend more, especially to small and private companies, to boost spending on infrastructure and promised 2 trillion yuan ($298 billion) in cuts to taxes and fees on businesses and households. Surprisingly, the official Manufacturing PMI in China rebounded strongly in March, suggesting that Beijing’s support policies are gaining traction. It marked the first increase in manufacturing activity since December last year and rose to a 6-month high of 50.5 in March from 49.2 in February, well above expectations. Furthermore , the service PMI edged up to 54.8 in March from 54.3 in February, as construction activities accelerated.
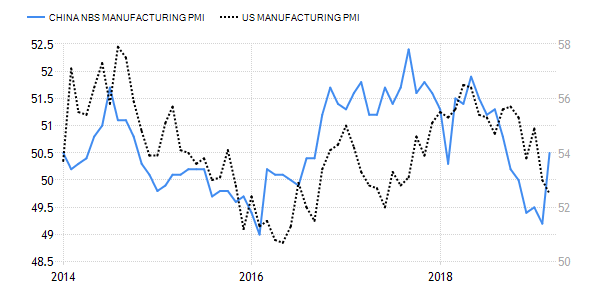
- Too much bad news is already discounted in the US bond market


