Date: 12 October, 2023 - Uncategorized
Who is to blame for the lack of Treasury demand?
The initial sell-off began on August 1st, when Fitch downgraded the US sovereign credit rating and the government supply upward revision. The sell-off continued with the surge of commodity prices and the Fed conveyed its higher for longer message by removing 2 cuts for the 2024 median dots.
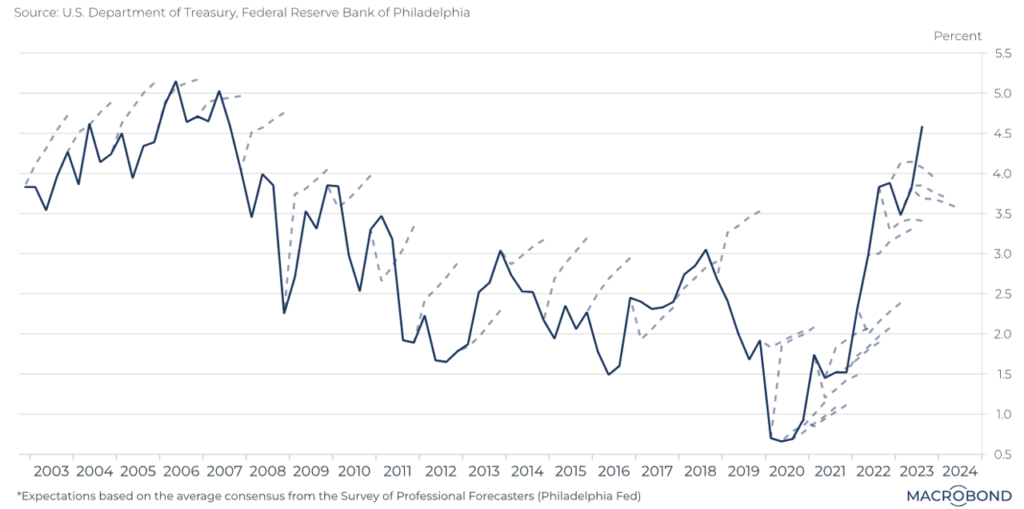
The Philadelphia Fed Survey of Professional Forecasters is one of the longest-running forecasting exercises. From 2003 through the onset of the pandemic, American top economists frequently predicted that bond yields would rise. After the worst of the pandemic, the bond bear market finally kicked in, but rising yields surpassed forecasters’ expectations. The most recent year shows how forecasters have turned bullish, i.e. calling for yields to fall. For now, the market is again defying their expectations.
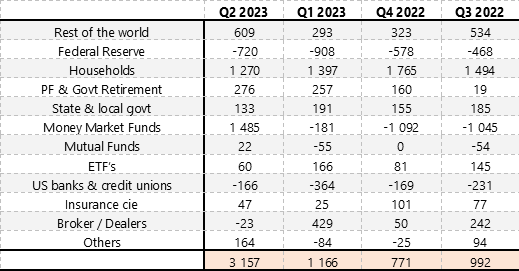
Another important piece of the puzzle is the demand dynamics for Treasuries. With the Fed (largest buyer since the pandemic) stepping away from the market, domestic real money investors, money market funds and the household category have had to absorb the additional supply.
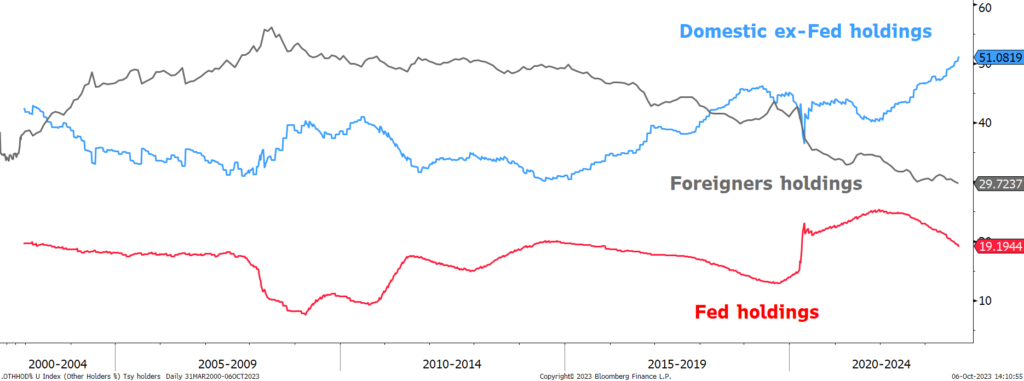
From the April 2022 peak, the Fed balance sheet has shrunk to $7.9trn from $9trn. That first 1trn came together with Fed Funds rate moving materially higher. The Fed has stated it aims to cut another $1.5trn by mid-2025. The increase in pace and size of Treasury supply came at a time when geopolitical landscapes have changed demand split from foreign to domestic investors.
Banks have been steadily reducing their holdings over the past year. With the sharp rise in rates, unrealized losses in banks’ balance sheets have risen sharply, further curbing their appetite to grow their portfolios. The regional banking crisis led to a liquidation of bank holdings although some of this was absorbed by the larger banks. As a result, households and money market fund holdings have risen sharply.
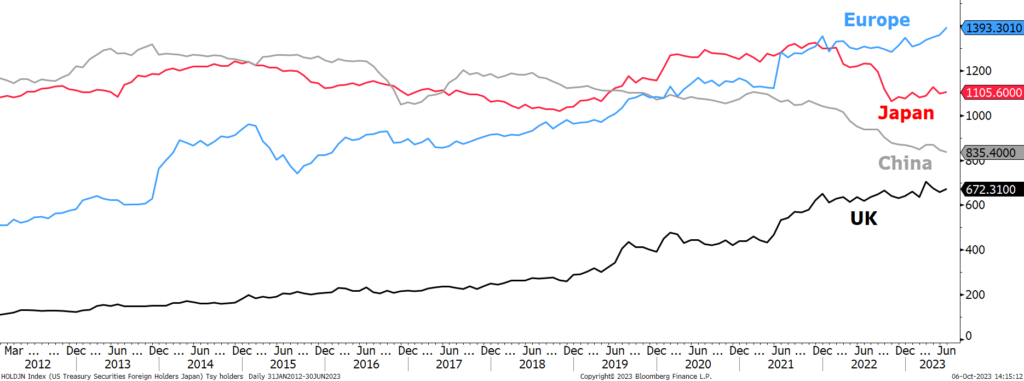
Although much has been said about the decline in foreign demand, foreign investors demand has been relatively stable. China has been steadily reducing its Treasury holdings since 2013, from a high of $1.29trn to $821bn now. Japan Treasury holdings peaked at $1.3tn in 2021 and have declined to $1.1trn. Despite these declines, foreign holdings have remained relatively stable and near historical highs, at $7.65trn, as other countries have stepped in.This normalization has steepened the yield curve even further. Using the analogue of 2018/19 and the taper tantrums witnessed then it is hard to view a world where we do not see higher volatility. However current yield increase move is matching those 2 episodes.
The Fed will be shortly forced to suspend its QT, otherwise the Treasury refunding, and cost of the debt will become unsustainable
US 10-year yield and professional forecasts
Main US Treasury holders per category (% marketable debt)
Foreign holdings near the highs at $7.6trn, despite less demand from China & Japan
US Treasury marketable debt flows ($bn) – The Fed & banks have strongly reduced their holdings